Table of Contents
Hydraulic Usage
Hydraulic Usage monitors subsea hydraulic control systems by calculating and recording hydraulic fluid use over time. The application will then analyse this data and raises alarms to warn of any nascent or catastrophic fluid leakage that is occurring in the system.
Try out the Hydraulic Usage app on the Industrial App Store
Page Descriptions
Hydraulic Usage Overview Page
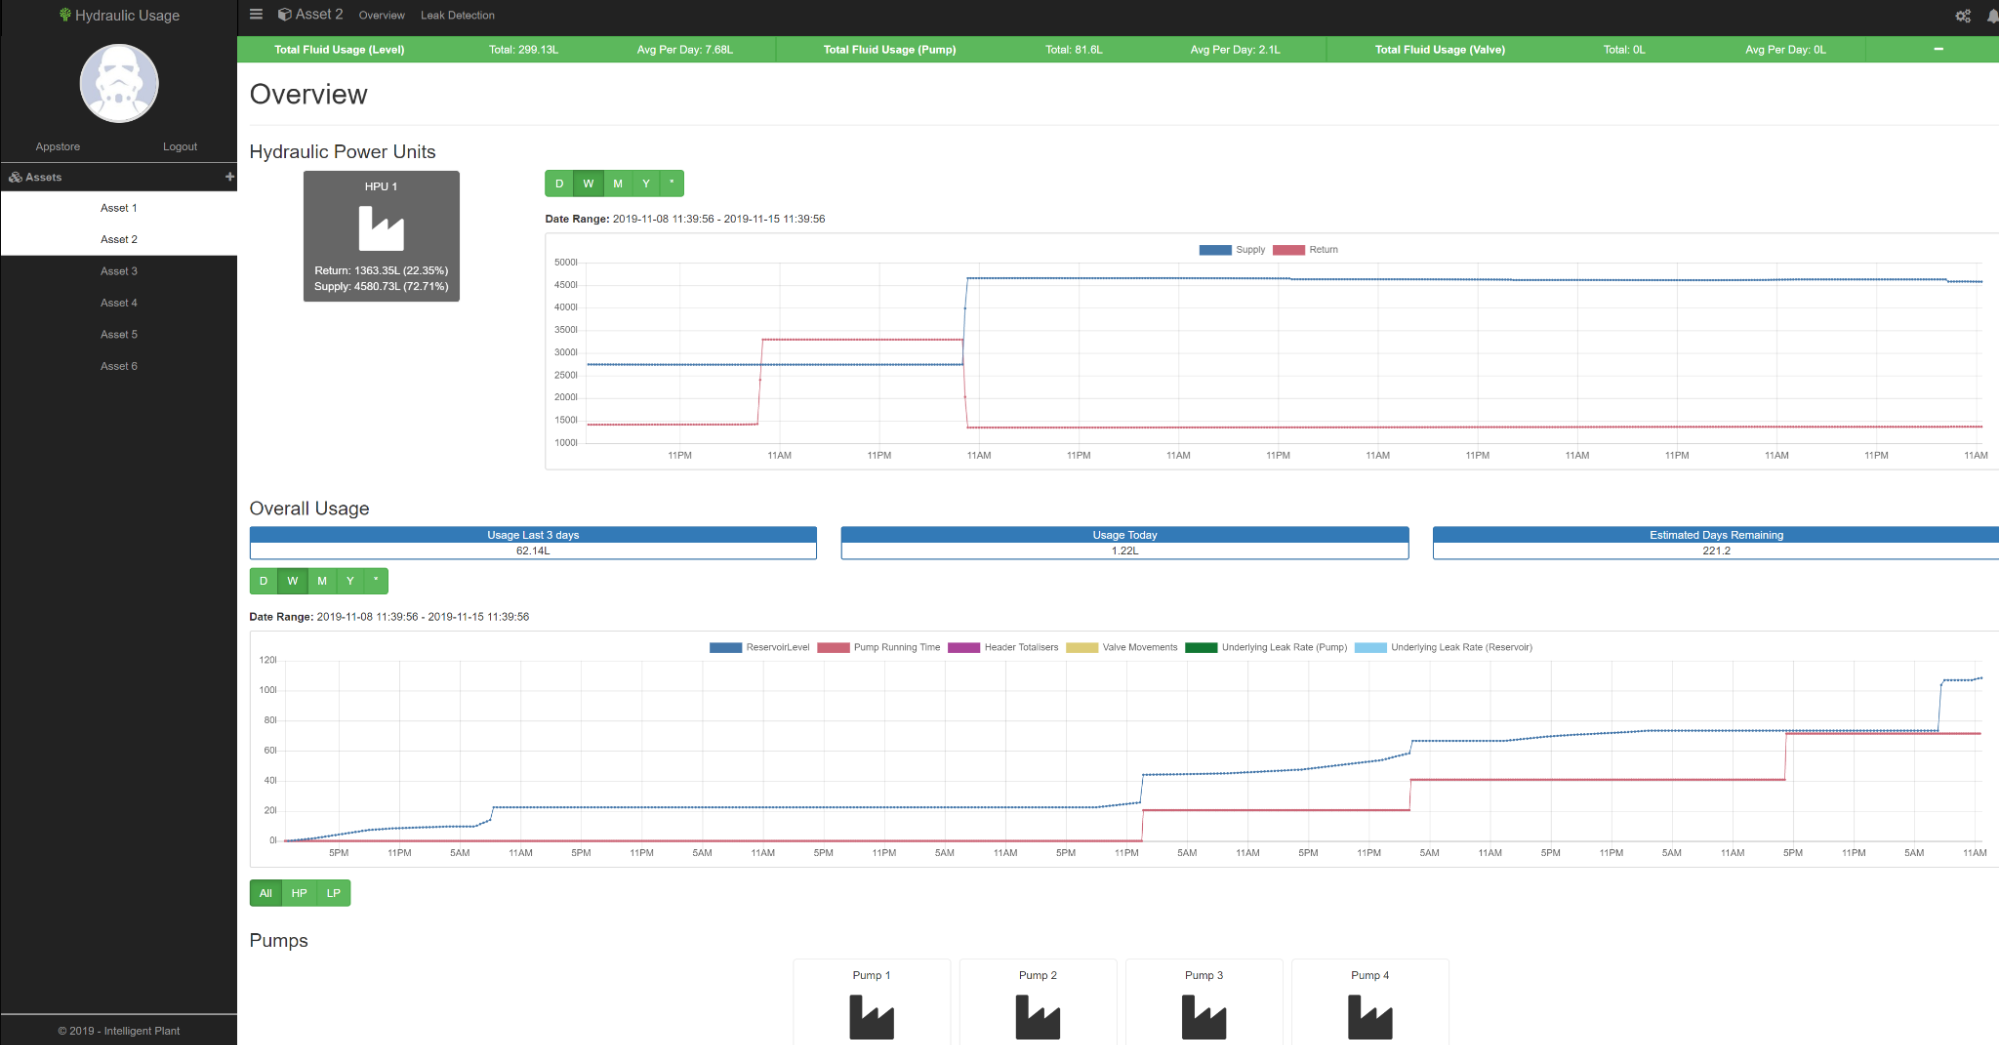
The Overview section of Hydraulic Usage provides results on the three different calculations available within the app; Reservoir Levels, Pump Run Times, and Valve Movement. These are all used to determine fluid usage within a set time. If configuration has been done correctly, Valve Movement values will provide the most accurate results. However, if the required data for Valve Movement is unavailable, then the previous two calculations can still be used for similar results.
At the top of the page, there is a green banner that provides key details on the total fluid usage calculated for reservoir level, pump run times, and valve movements since the last reset. Using these totals, a per day average is calculated for each calculation method. This total can be reset by clicking the minus icon on the right of the banner.
Reservoir Levels
Reservoir Levels utilises data from the reservoir to calculate fluid usage. It shows the historical levels of the Hydraulic Power Unit (HPU) supply and return reservoirs. It contains logic to remove noise caused by external sources such as swaying from wave and tidal movements, and reservoir refilling.
Overall usage is shown for the current day, the last 3 days, along with an average usage per day, and the estimated days remaining at current levels.

The fluid Usage graph displays historical fluid usage based on each of the three calculations. In the above image, only reservoir level and pump running time are shown.
Pump Run Times
Pump Run Times utilises details on pumps that have been configured on the app. This calculation takes nominal flow rates of the pumps and calculates the total amount of fluid that has passed through the pump based on running time. This calculation can also be performed without a known running time, as long as data such as an On/Off pump switch is available, the calculation can be carried out.

Pumps will be displayed as shown on the above figure and show their nominal flow and run count for each. The user has the option of selecting only low or high pressure pumps.

Fluid usage for each pump is then shown on the Pump Fluid Usage graph

Pump Runs graph shows when a pump run has occurred within the set time period; A value of 0 on the Y axis indicates pump was not active, and a value of 1 indicates that the pump was active.

Finally, Time Between Runs shows the On to On time for the pumps. In the above figure, it can be seen that time between runs for LP Pump A and LP Pump B decreased, therefore telling us that their activity has increased.
Valve Movement
The Valve Movement calculation uses valve status tags which show when the valves are moving, along with valve swept volume to determine fluid usage. This is the most accurate of the three calculations as valve actuation will require specific amounts of hydraulic fluid to operate, thus less noise is associated with this method.
How to configure an asset
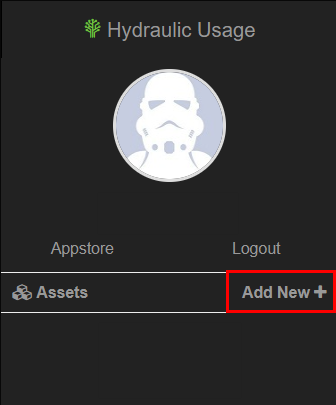
Firstly, select “Add New” on the left menu
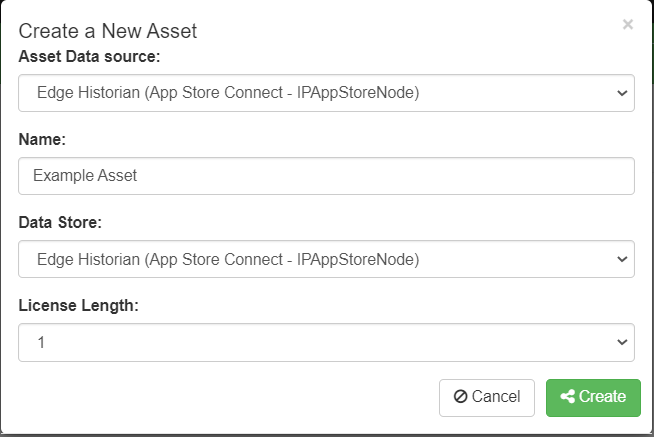
This gives the user a blank asset in which they can configure.
Asset Settings
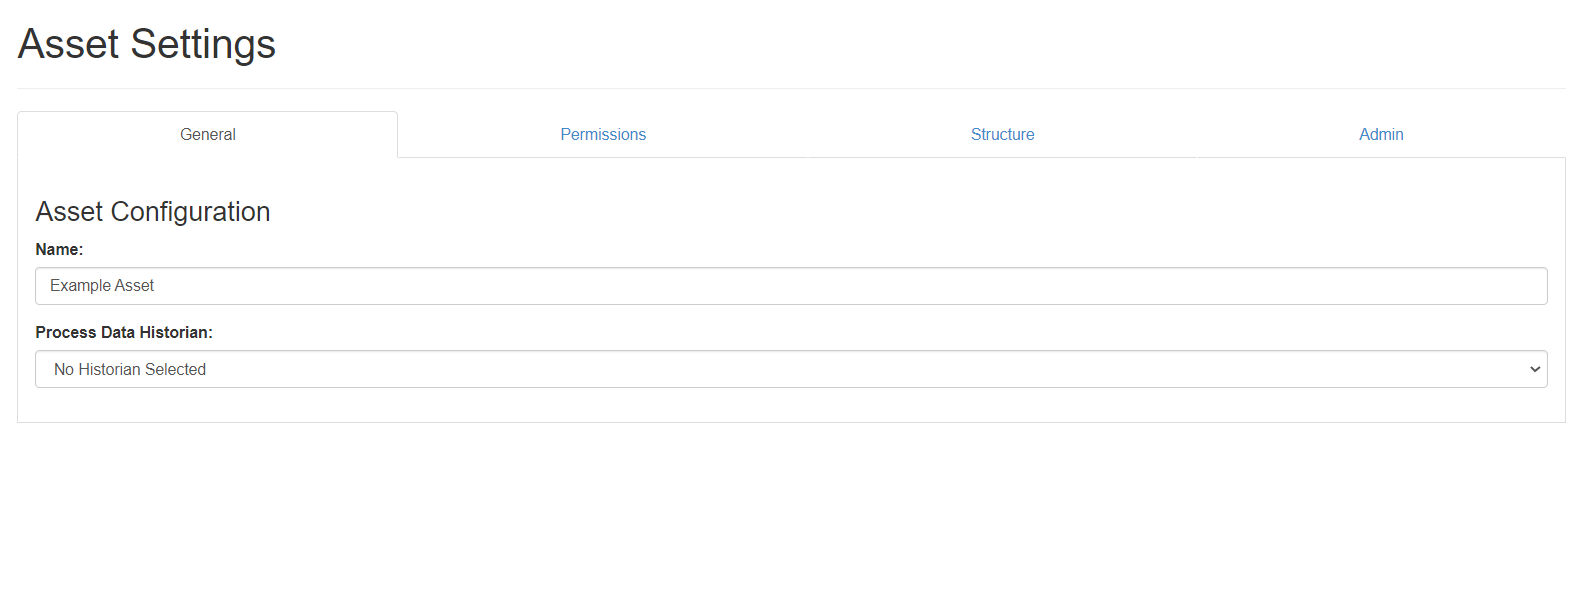
For further asset configuration, select “Asset Settings” at the top right of your page. This will take you to the Asset Settings page that contains four tabs:
General
Enter a name for the new asset and select the Process Data Historian which is where the output values will be written to.
Permission
Structure
This is the main section of configuration where the hierarchy and details of components is set.

The Structure section is where the majority of the configuration will occur. The hierarchy of the components will follow the following structure:

Hydraulic Power Units
Upon clicking the tab, the user will see the base hierarchical component - the hydraulic power unit. This requires the following data:
- Supply reservoir capacity (litres)
- Return reservoir capacity (litres)
- Reservoir level unit (% or litres)
- Supply and return reservoir level tags.
NB:The minimum requirements for the Hydraulic Usage App to function are the above HPU Levels.
Hydraulic Systems
The second stage of configuration is of the HP and LP hydraulic systems. These require only a name and abbreviation.
Fields
The final stage of configuration are the fields. These only require names and are used exclusively for grouping of components.
Within the field level, wells can be defined. Wells require a name and water depth (metres).
Wells can have many valves associated with them. Adding valves will require the following data:
- Function type
- Status tag
- Pressure tag
- Subsea Control Module (optional)
- Associated well
Finally, pumps can be added to the hierarchy. They require the following data:
- Function
- Nominal flow (litres/min)
- Running time tag
- Service tag
- Status tag
- Pressure tag
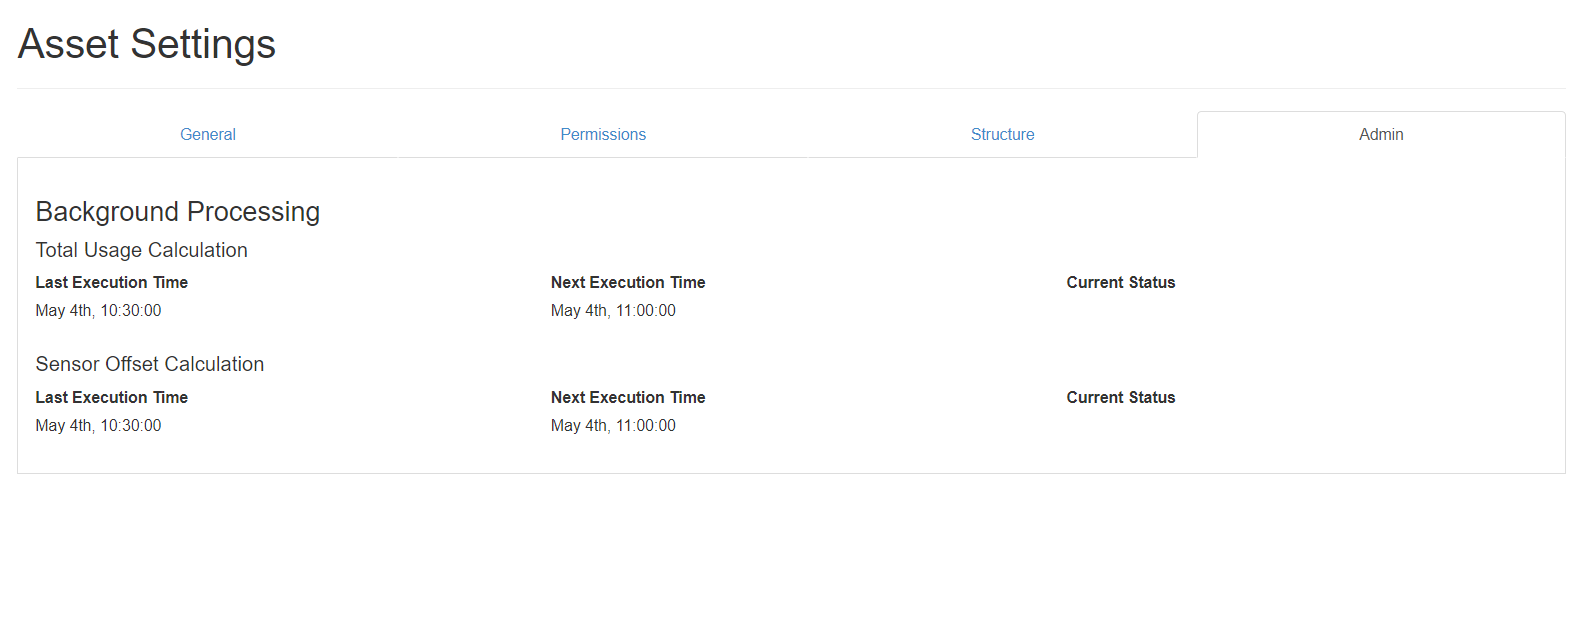
Admin
Mainly to be used by developers, this tab provides information about whether the calculation for hydraulic usage has succeeded or failed.
Output tags
The following output tags are supplied from the Hydraulic Usage app:
Cumulative Usage Tags:
- HydraulicUsage/{Asset}/FluidUsage/ReservoirLevel
- HydraulicUsage/{Asset}/FluidUsage/PumpRunningTime
- HydraulicUsage/{Asset}/FluidUsage/ValveMovements
Leakage Tags:
- HydraulicUsage/{Asset}/Leak/ReservoirLevel
- HydraulicUsage/{Asset}/Leak/PumpRunningTime
Sensor Offsets (one generated per sensor):
- HydraulicUsage/{Asset}{Field}/{WellId}/{System}/{SensorName}.SensorOffsetAverage
The tags associated with cumulative usage and leakage are the standard five tags, sensor tags are dependent on the amount of configuration added to the app. For every sensor configured, a sensor tag will be created. Therefore, the number of output tags could increase substantially.

