This is an old revision of the document!
Table of Contents
Getting started
This is a quick guide on how to connect and get easy access to your data within Power BI dashboards, reports and datasets.
What is the Power BI Connector?
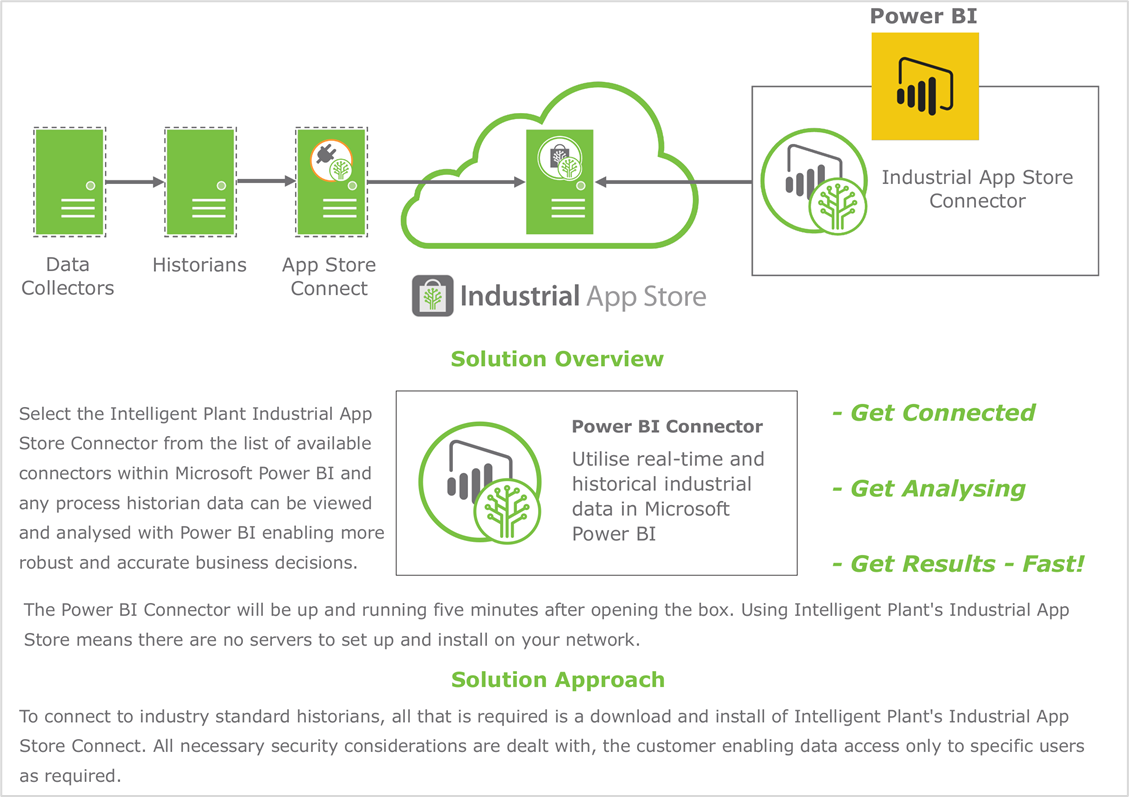
The Power BI Connector solves a common industry problem - getting operational data into Power BI.
Historian data does not come in the tabular format that Power BI desires. Our connector completes this essential task in a way that requires no complicated queries, no secondary data storage location, and no SQL - We connect straight from your historian with our data connectivity software, App Store Connect.
Users commonly use our Power BI Connector to import process data. However, you can also import Alarm & Event data, along with.calculated alarm KPIs
Getting the connector
Intelligent Plant's Industrial App Store Power BI Connector is Microsoft Certified and distributed with Power BI as of the (May 2019) update.
Connect to your data
- Open Power BI Desktop.
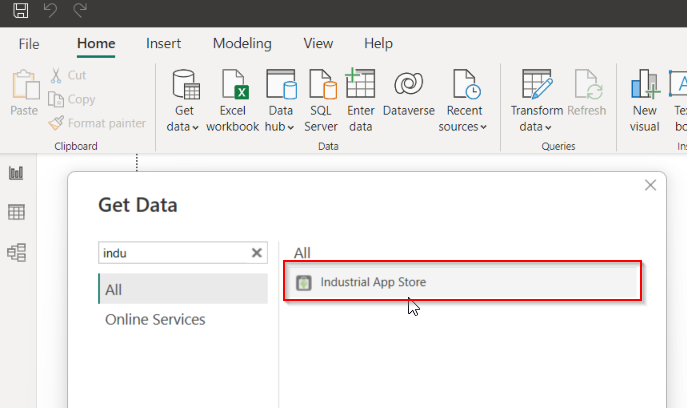
- Click “Get Data” on the Home tab and search for “Industrial App Store”.
- Sign in to the Industrial App Store using either service provided.
- Select the data source you would like to query.
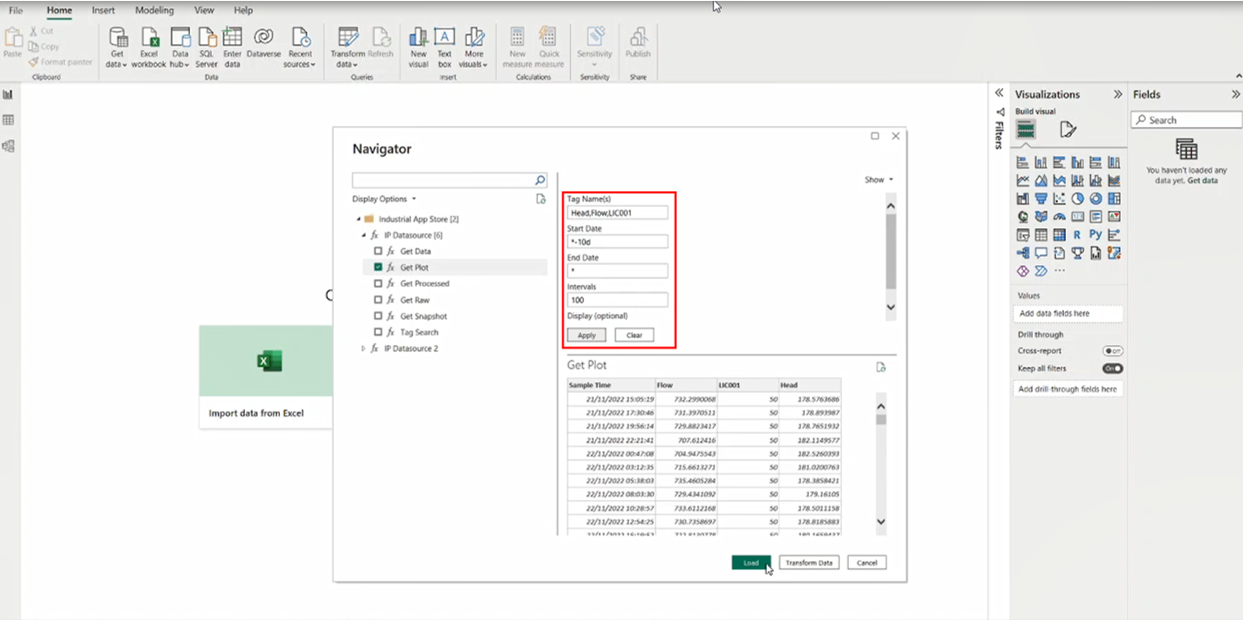
- Use the “Tag Search” function to perform tag searches, “Get Processed” function to get data from your data source in a variety of aggregations, and “Get Plot” function, designed specifically for visualising your operational data.
- Enter your tag name(s), start date, end date, function and interval/point count.
- Click “Load” to import the queried dataset into the dashboard.
Video Walkthrough
For more information, you can check our Power BI Connector YouTube walkthrough.
Please note, the connector has received updates since the creation of this video - the configuration will look different now, however it remains fundamentally similar.
Feel free to get in touch with us if you need assistance setting up the connector or if you have any questions.
Licensing
Customers need to purchase a subscription in order to retrieve data using Industrial App Store (IAS) Connector. Pleasecontact Intelligent Plant or ping us an email at info@intelligentplant.com if you have questions.
- An unlicensed data response in IAS Connector will look like this:
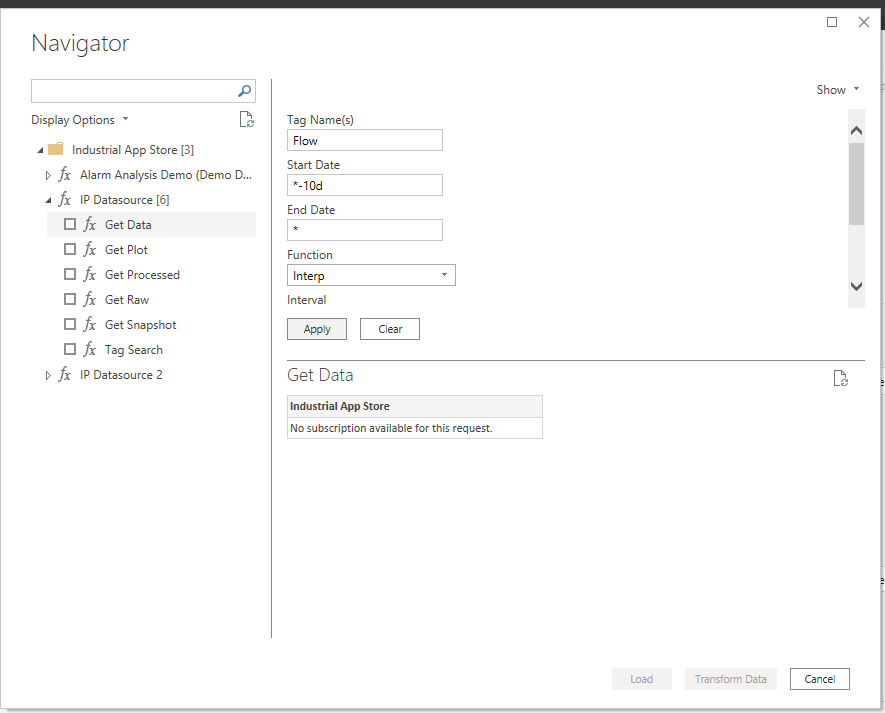
- Licenses can cover a subset of available data. For example, we can license only tags that begin with FL*. In this scenario, a request multiple tags that are and aren't covered under this rule will look like so:
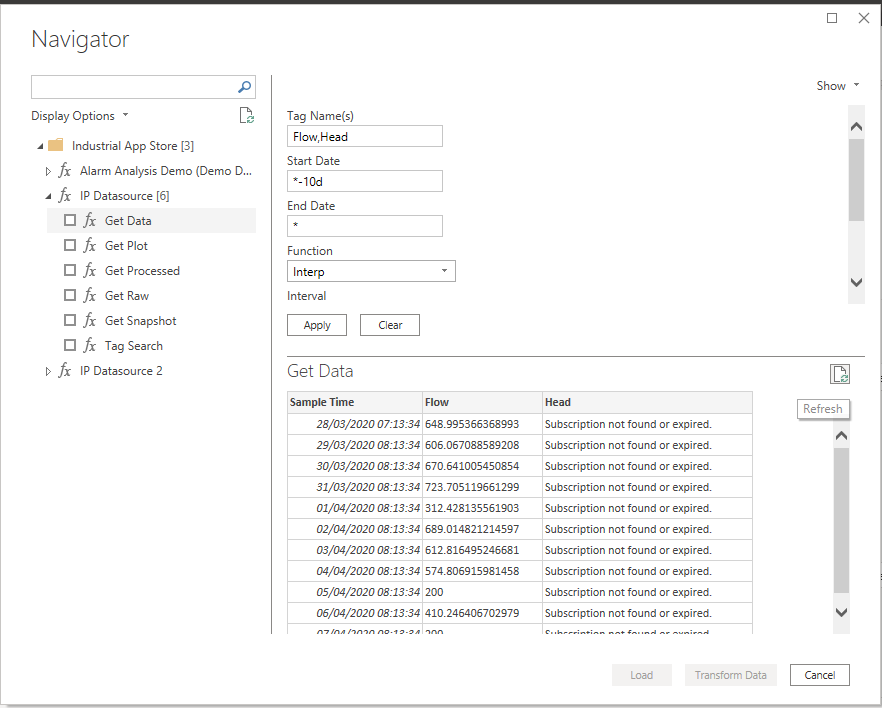
- And of course, a full license will just display the data as is:
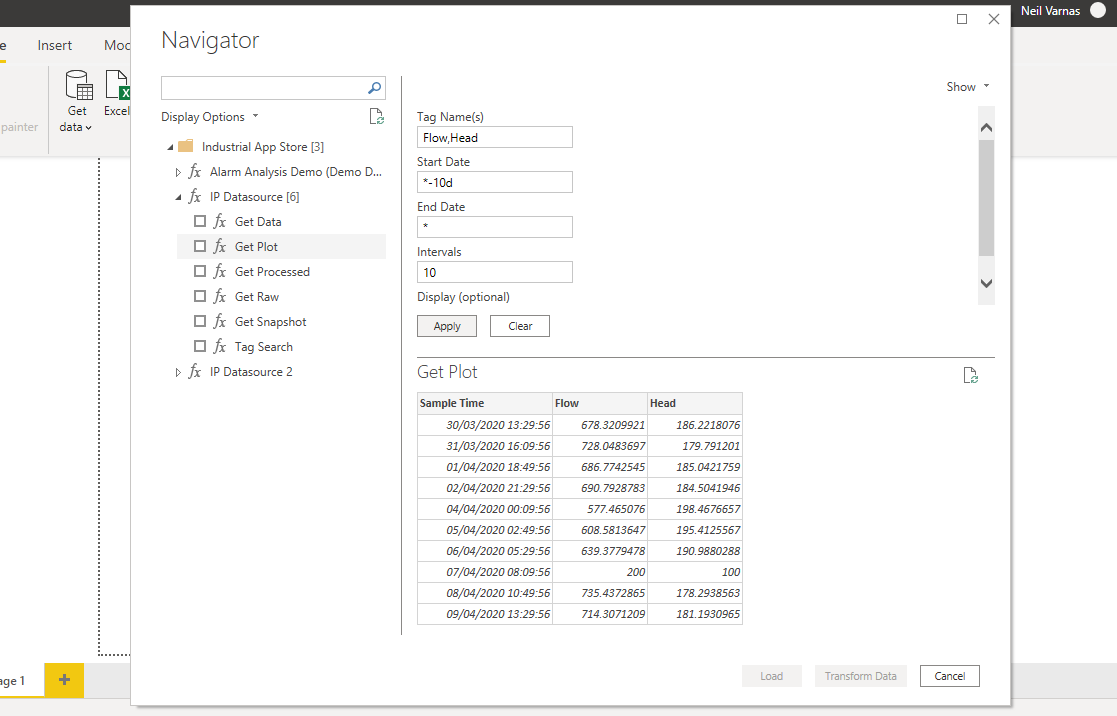
How do I fill out the "Get" queries?
Get Processed
| Name | Required | Type | Description | Default | Example | ||||||
| Tag Name(s) | true | string | Comma separated tag names to get data for. | n/a | Sinusoid,LIC040 | ||||||
| Start Date | true | string | Absolute or relative start time to use when performing the data query. | n/a | *-10d, 2018-01-15 | ||||||
| End Date | true | string | Absolute or relative end time to use when performing the data query. | n/a | *, *-1h, 2020-09-01T00:00:00 | ||||||
| Function | true | option | Data function/aggregation to use when performing data query. | n/a | Interp, Plot, Min, Max, Avg, Raw | ||||||
| Interval | false | string | The sample interval. | n/a | 20s, 3h, 1d | ||||||
| Display | false | option | Indicate whether to display numerical, string or both tag values. Some tags (digital) might indicate a status which has a more meaningful text value, e.g.OFF, representation than a numerical value, e.g. 0. | Numeric |
Get Plot
| Name | Required | Type | Description | Default | Example | ||||||
| Tag Name(s) | true | string | Comma separated tag names to get data for. | n/a | Sinusoid,LIC040 | ||||||
| Start Date | true | string | Absolute or relative start time to use when performing the data query. | n/a | *-10d, 2018-01-15 | ||||||
| End Date | true | string | Absolute or relative end time to use when performing the data query. | n/a | *, *-1h, 2020-09-01T00:00:00 | ||||||
| Interval | false | string | The maximum number of points to return per tag. | n/a | 20s, 3h, 1d | ||||||
| Display | false | option | Indicate whether to display numerical, string or both tag values. Some tags (digital) might indicate a status which has a more meaningful text value, e.g.OFF, representation than a numerical value, e.g. 0. | Numeric |
Get Raw
| Name | Required | Type | Description | Default | Example | ||||||
| Tag Name(s) | true | string | Comma separated tag names to get data for. | n/a | Sinusoid,LIC040 | ||||||
| Start Date | true | string | Absolute or relative start time to use when performing the data query. | n/a | *-10d, 2018-01-15 | ||||||
| End Date | true | string | Absolute or relative end time to use when performing the data query. | n/a | *, *-1h, 2020-09-01T00:00:00 | ||||||
| Interval | false | string | The maximum number of points to return per tag. | n/a | 20s, 3h, 1d | ||||||
| Display | false | option | Indicate whether to display numerical, string or both tag values. Some tags (digital) might indicate a status which has a more meaningful text value, e.g.OFF, representation than a numerical value, e.g. 0. | Numeric |
Tag Search
| Tag Name | Required | Type | Description | Default | Example | ||||||
| Tag Name(s) | true | string | The name filter to use. | * | LIC* | ||||||
| Page size | false | number | Page size for the results. | 20 | 5 | ||||||
| Page number | false | number | The page number of the matching results that should be returned. | 0 | 2 |
Get Snapshot
| Name | Required | Type | Description | Default | Example | ||||||
| Tag Name(s) | true | string | Comma separated tag names to get data for. | n/a | Sinusoid,LIC040 | ||||||
| Display | false | option | Indicate whether to display numerical, string or both tag values. Some tags (digital) might indicate a status which has a more meaningful text value, e.g.OFF, representation than a numerical value, e.g. 0. | Numeric |
Get Data
Please note - “Get Data” is part of our legacy API. We highly recommend using the “Get Processed” and “Get Plot” functions instead
| Name | Required | Type | Description | Default | Example | ||||||
| Tag Name(s) | true | string | Comma separated tag names to get data for. | n/a | Sinusoid,LIC040 | ||||||
| Start Date | true | string | Absolute or relative start time to use when performing the data query. | n/a | *-10d, 2018-01-15 | ||||||
| End Date | true | string | Absolute or relative end time to use when performing the data query. | n/a | *, *-1h, 2020-09-01T00:00:00 | ||||||
| Function | true | option | Data function/aggregation to use when performing data query. | n/a | Interp, Plot, Min, Max, Avg, Raw | ||||||
| Interval | false | string | The sample interval. | n/a | 20s, 3h, 1d | ||||||
| Number of Points | false | number | The maximum number of points to return per tag. Takes precedence over the Interval parameter if both specified. | n/a | 10, 150 | ||||||
| Display | false | option | Indicate whether to display numerical, string or both tag values. Some tags (digital) might indicate a status which has a more meaningful text value, e.g.OFF, representation than a numerical value, e.g. 0. | Numeric |
Setting background data refresh
- Using the web app.
- Using personal data gateway - instructions available here.

